If you truly want to improve your trading, learning candlestick patterns for beginners is one of the most important steps in your journey.
After understanding how to read forex charts, the next stage is learning how to interpret what each candle is actually telling you. This is where candlestick patterns become powerful.
Candlestick patterns help traders understand market behavior, spot possible reversals, and make better trading decisions based on price action instead of guesswork.
When I first started trading, I used to look at candles without understanding what they meant. Everything looked random. But once I learned patterns, the market started to make more sense.
It took me a while to understand the idea behind a single candle. You might think there is some hidden secret, but there is none. Every candle simply shows who is in control between buyers and sellers.
In this guide, you will learn the most important candlestick patterns in a simple and practical way.
Before you continue, make sure you understand how to read forex charts for beginners, because this will help you understand these patterns better.
Table of Contents
What Are Candlestick Patterns?
Candlestick patterns are formations created by one or more candles on a forex chart. These formations give traders clues about what the market might do next.
They help you understand whether buyers or sellers are in control, whether a trend might continue, or whether a reversal could happen soon. In simple terms, candlestick patterns are the language of price action.
Why Candlestick Patterns Are Important?
Candlestick patterns are important because they help you understand market psychology. Instead of guessing, you begin to see what is actually happening between buyers and sellers.
They also help you improve your timing. Instead of entering trades randomly, you can wait for confirmation from price action. This reduces emotional trading and improves decision making.
Types of Candlestick Patterns
Candlestick patterns are generally grouped into three categories. There are bullish patterns, which suggest that price may move upward, bearish patterns, which suggest that price may move downward, and continuation or indecision patterns.
Bullish Candlestick Patterns
Hammer
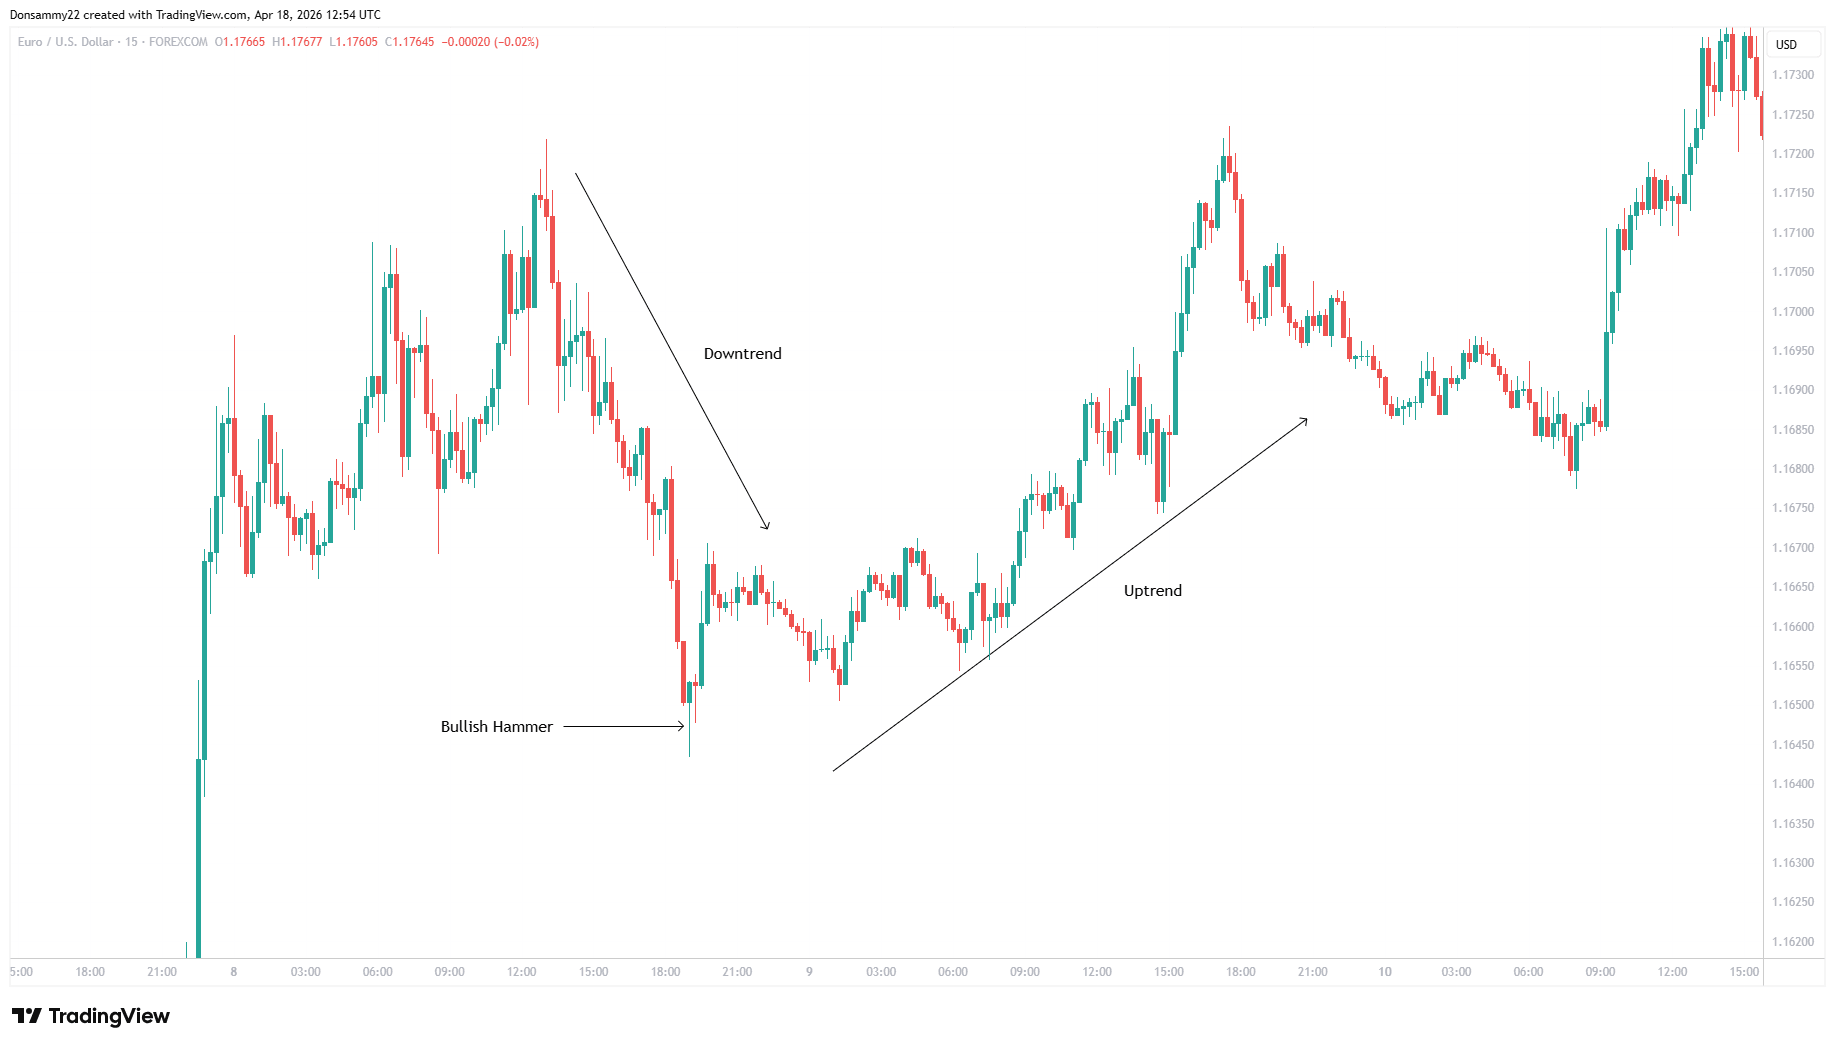
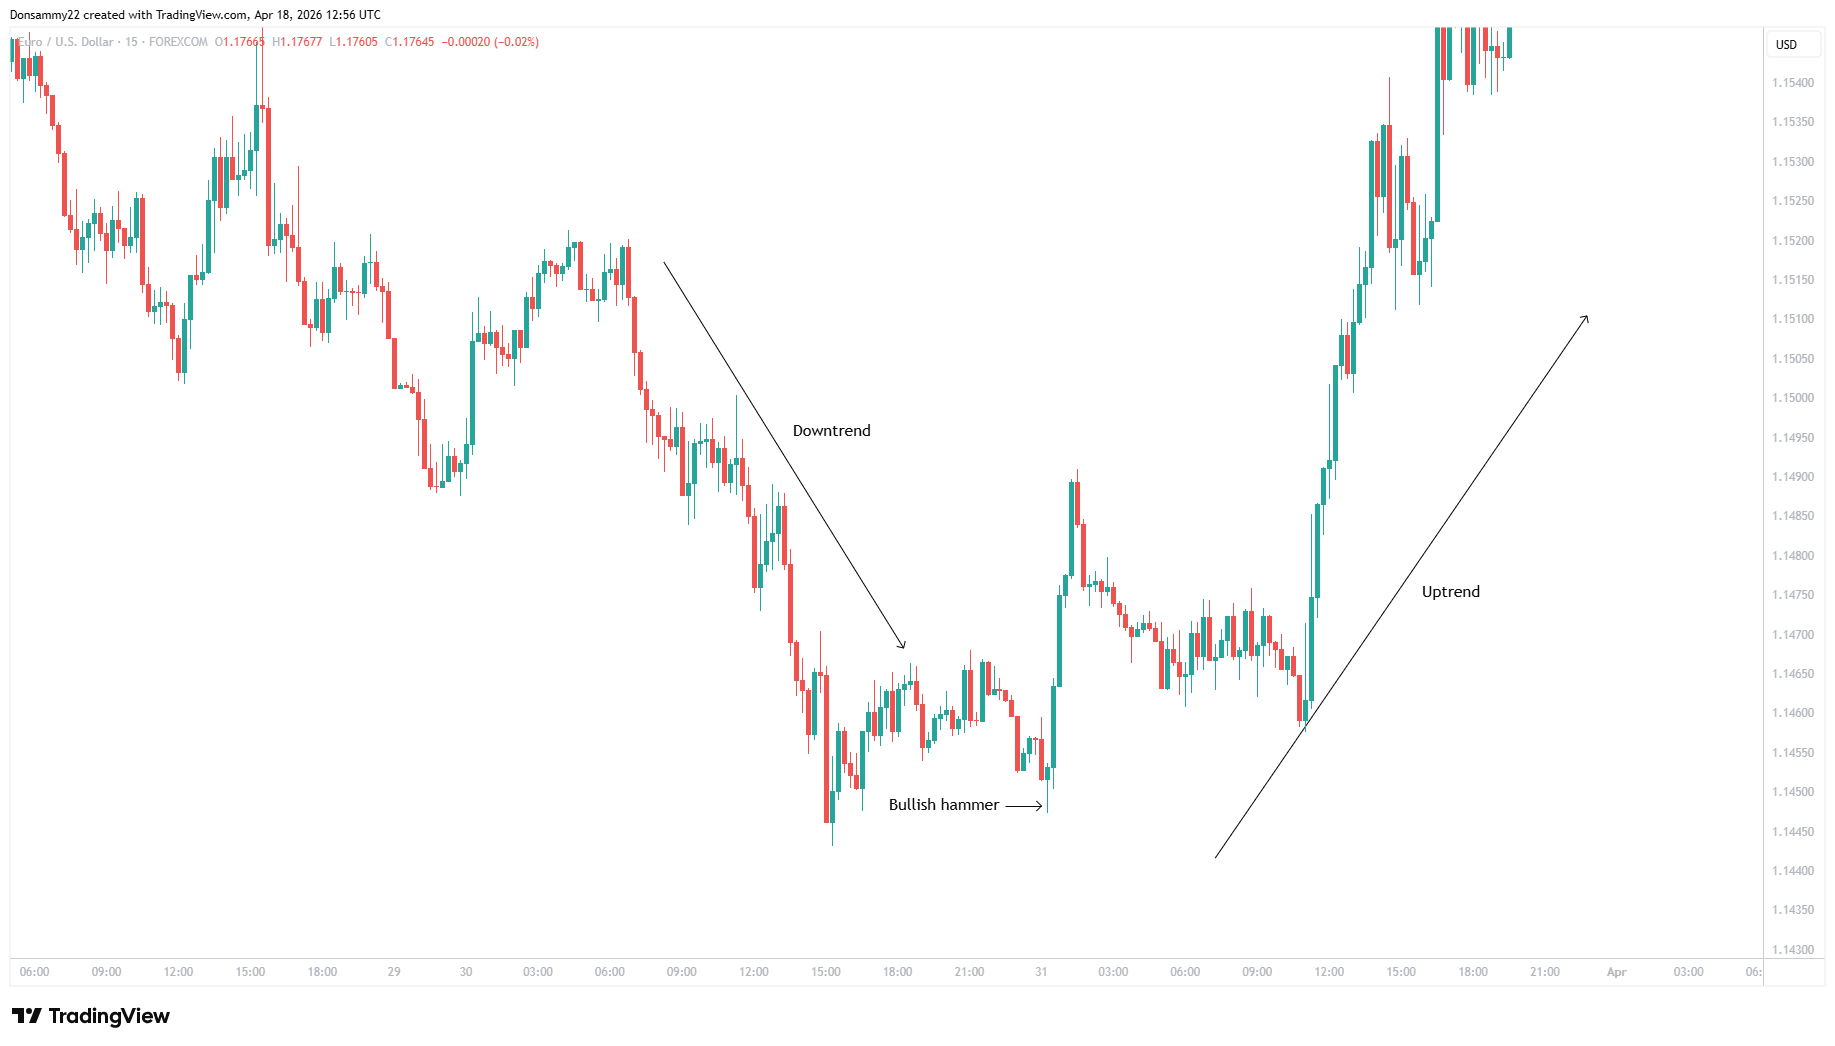
The hammer is one of the most common bullish patterns. It usually appears after a downtrend and signals that buyers are starting to gain control. The candle has a small body with a long lower wick, showing that price was pushed down but later rejected.
Examples On Chart
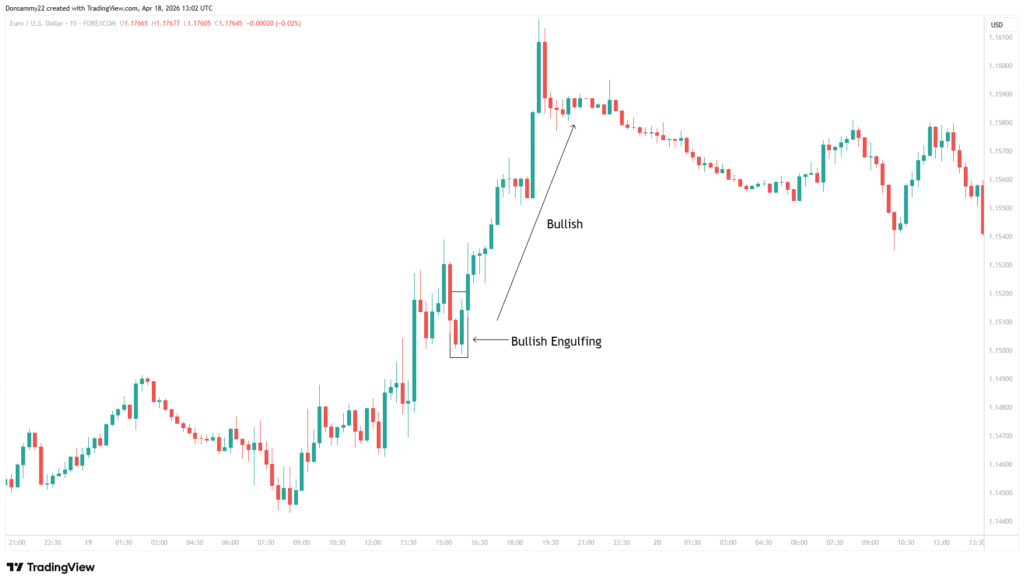
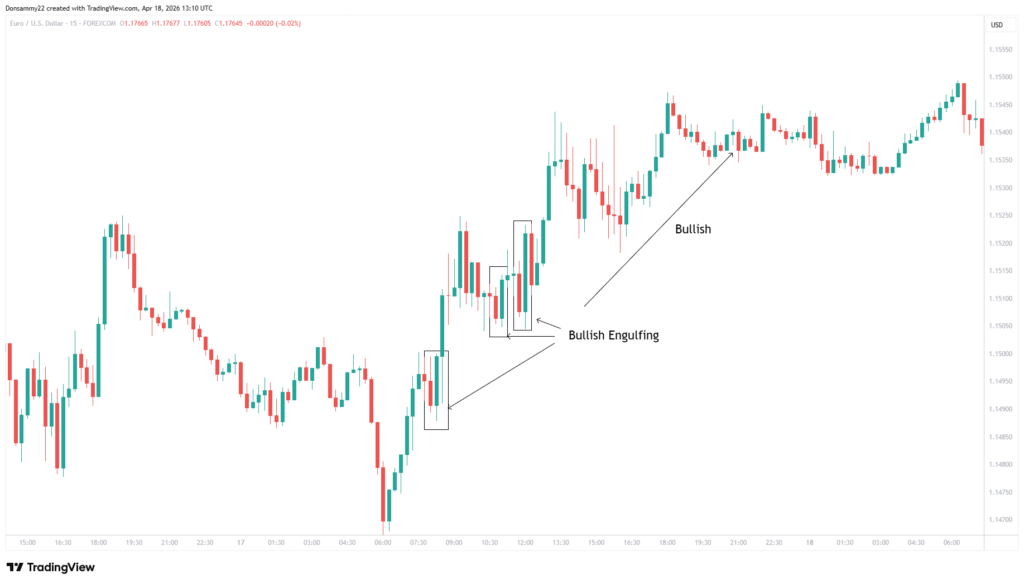
Bullish Engulfing Pattern
This is another strong bullish pattern. It occurs when a bearish candle is followed by a larger bullish candle that completely covers it. This shows that buyers have taken control of the market.
Examples On Chart
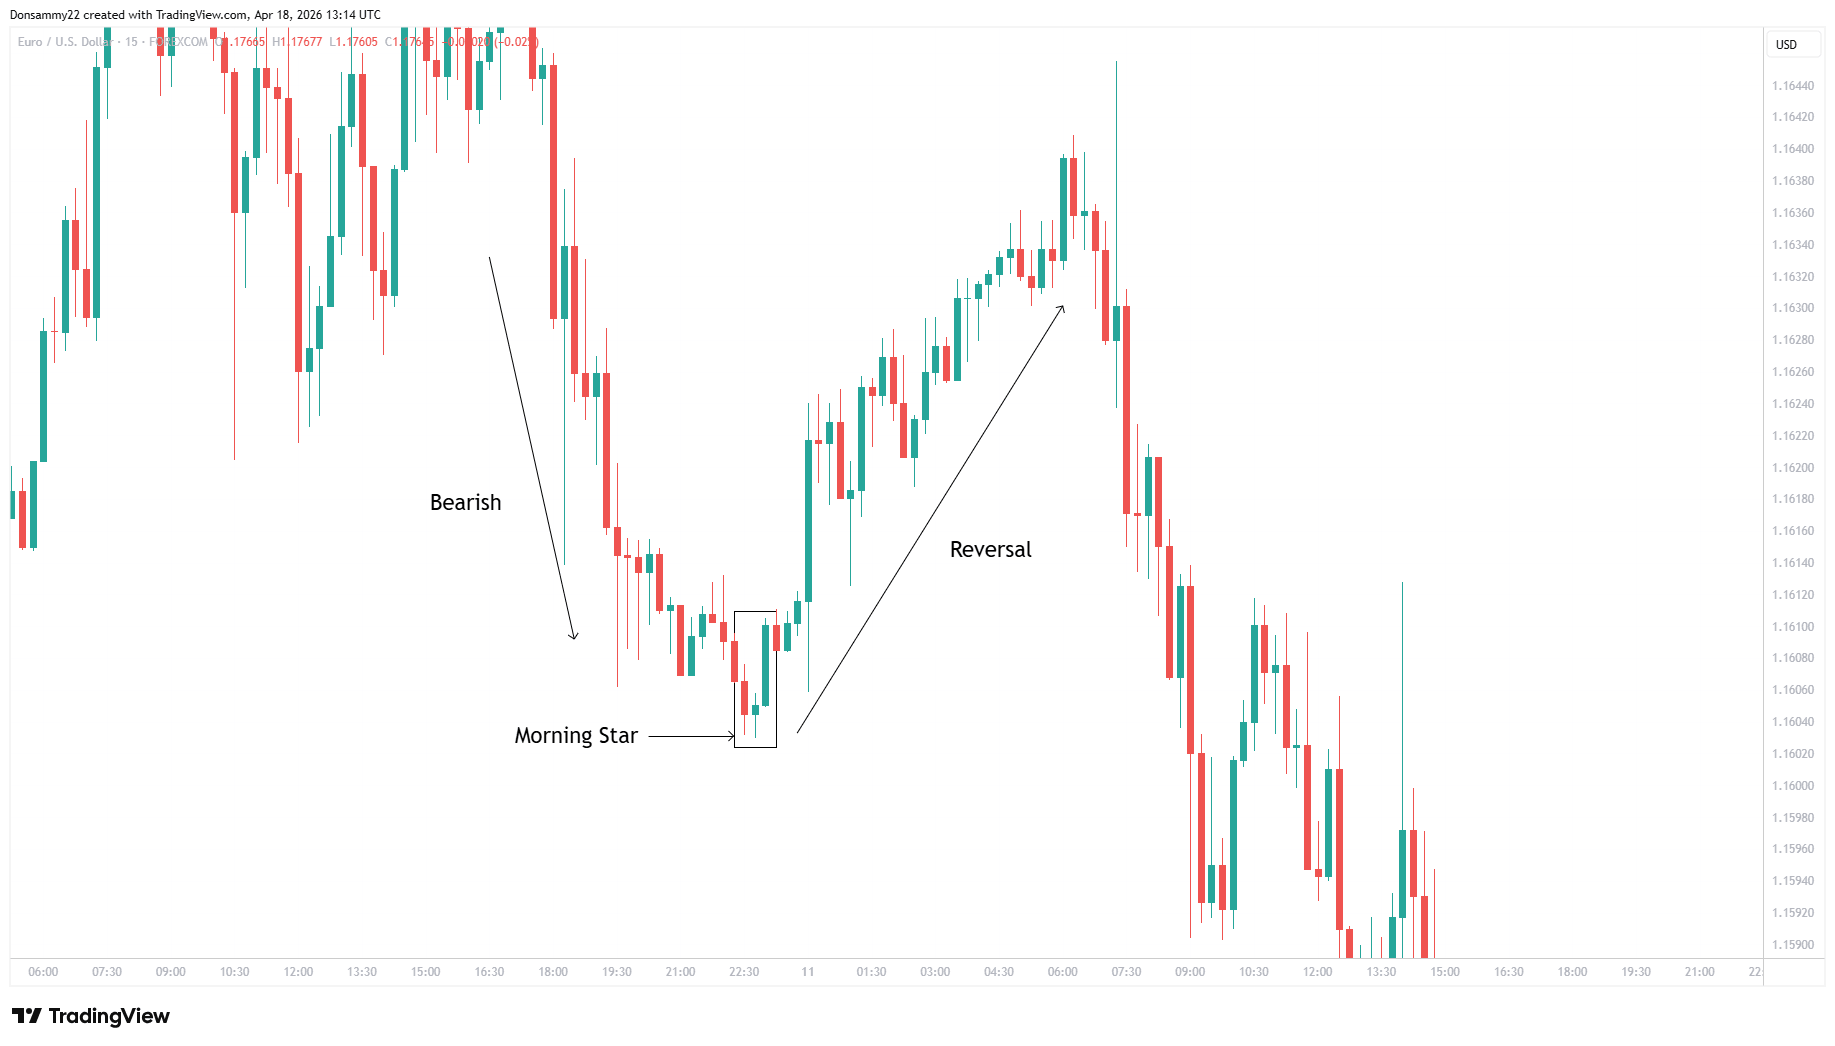
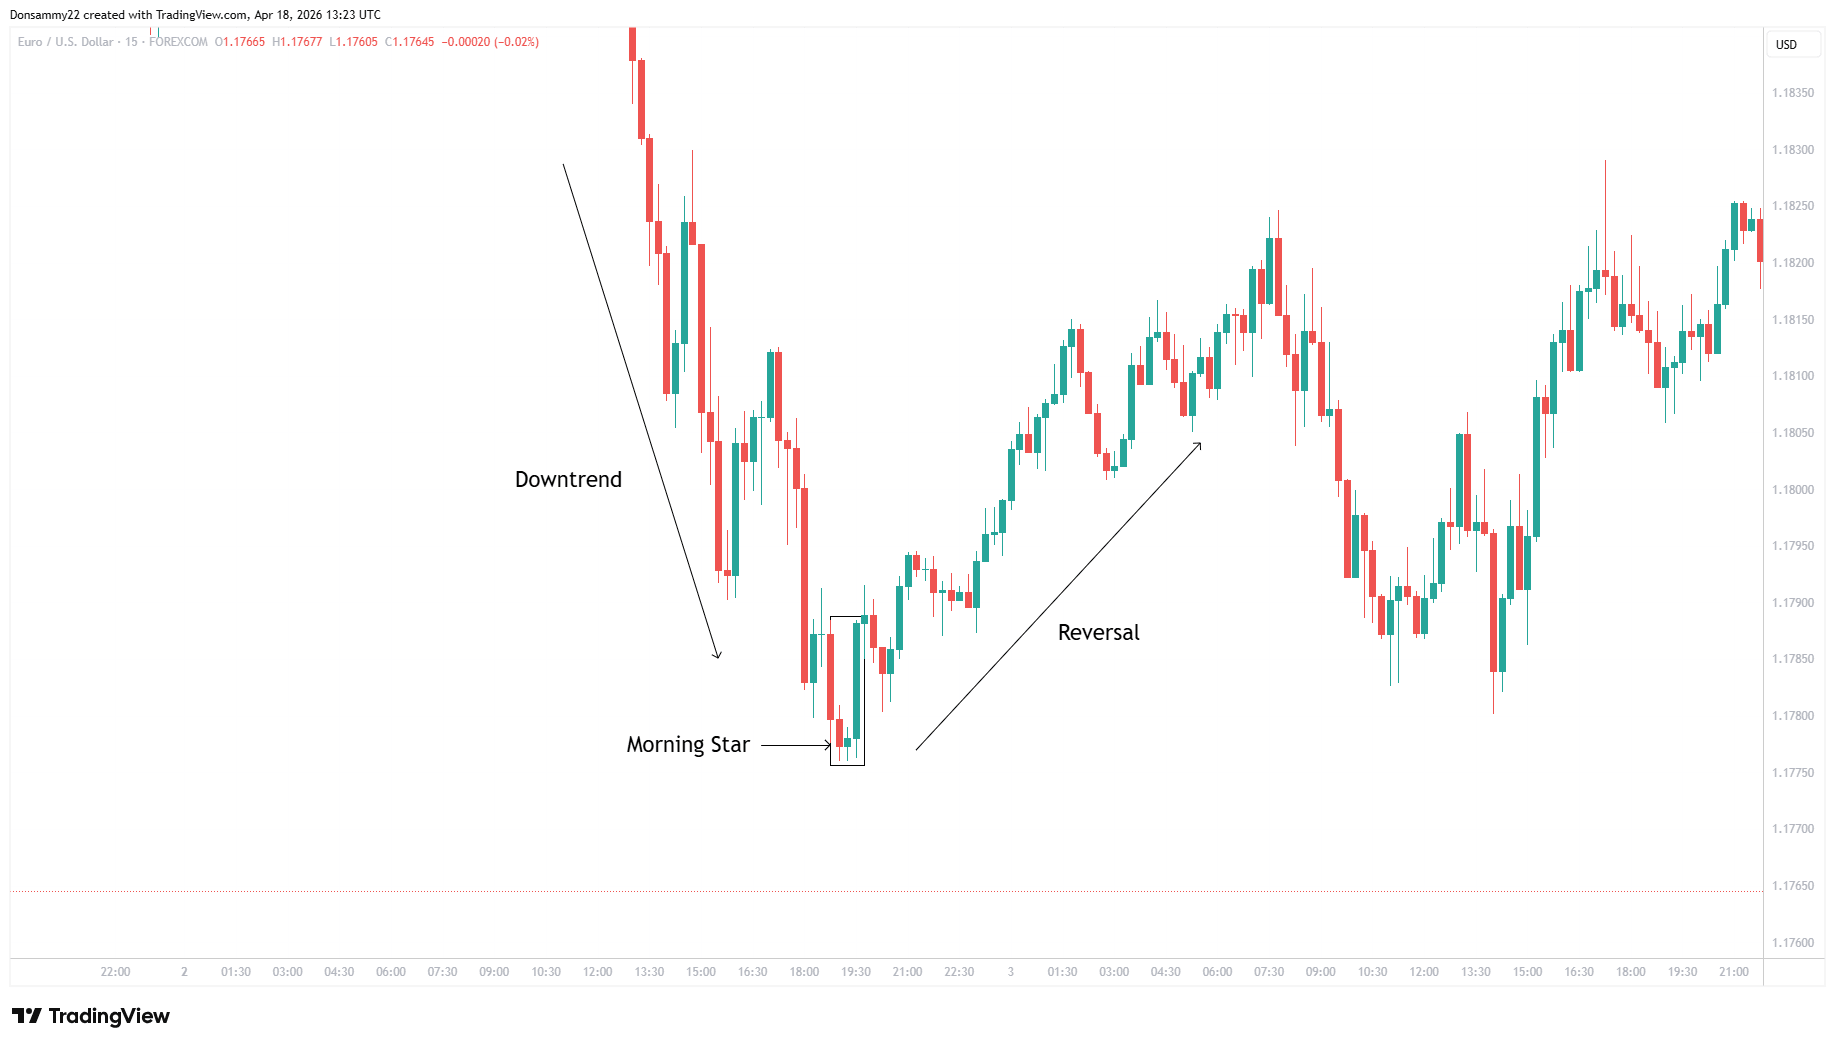
Morning Star
The morning star is a strong bullish reversal pattern. It forms in three stages: a bearish candle, a small indecision candle, and a strong bullish candle. It usually signals that a downtrend is ending.
Examples On Chart
Bearish Candlestick Patterns
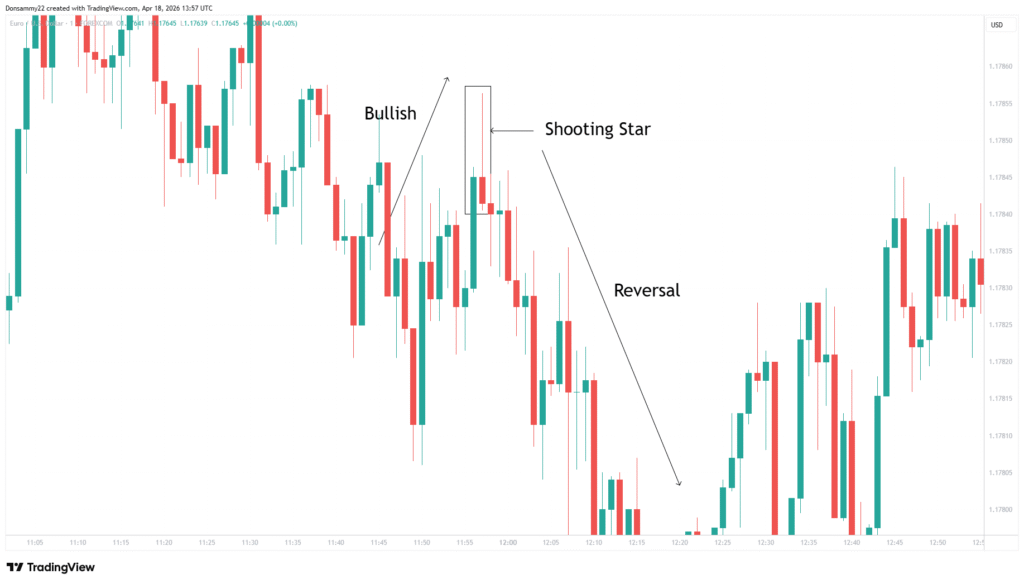
Shooting Star
The shooting star is a common bearish reversal pattern. It appears after an uptrend and shows that buyers pushed price higher, but sellers forced it back down before the candle closed. This often signals weakness in the market.
Examples On Chart
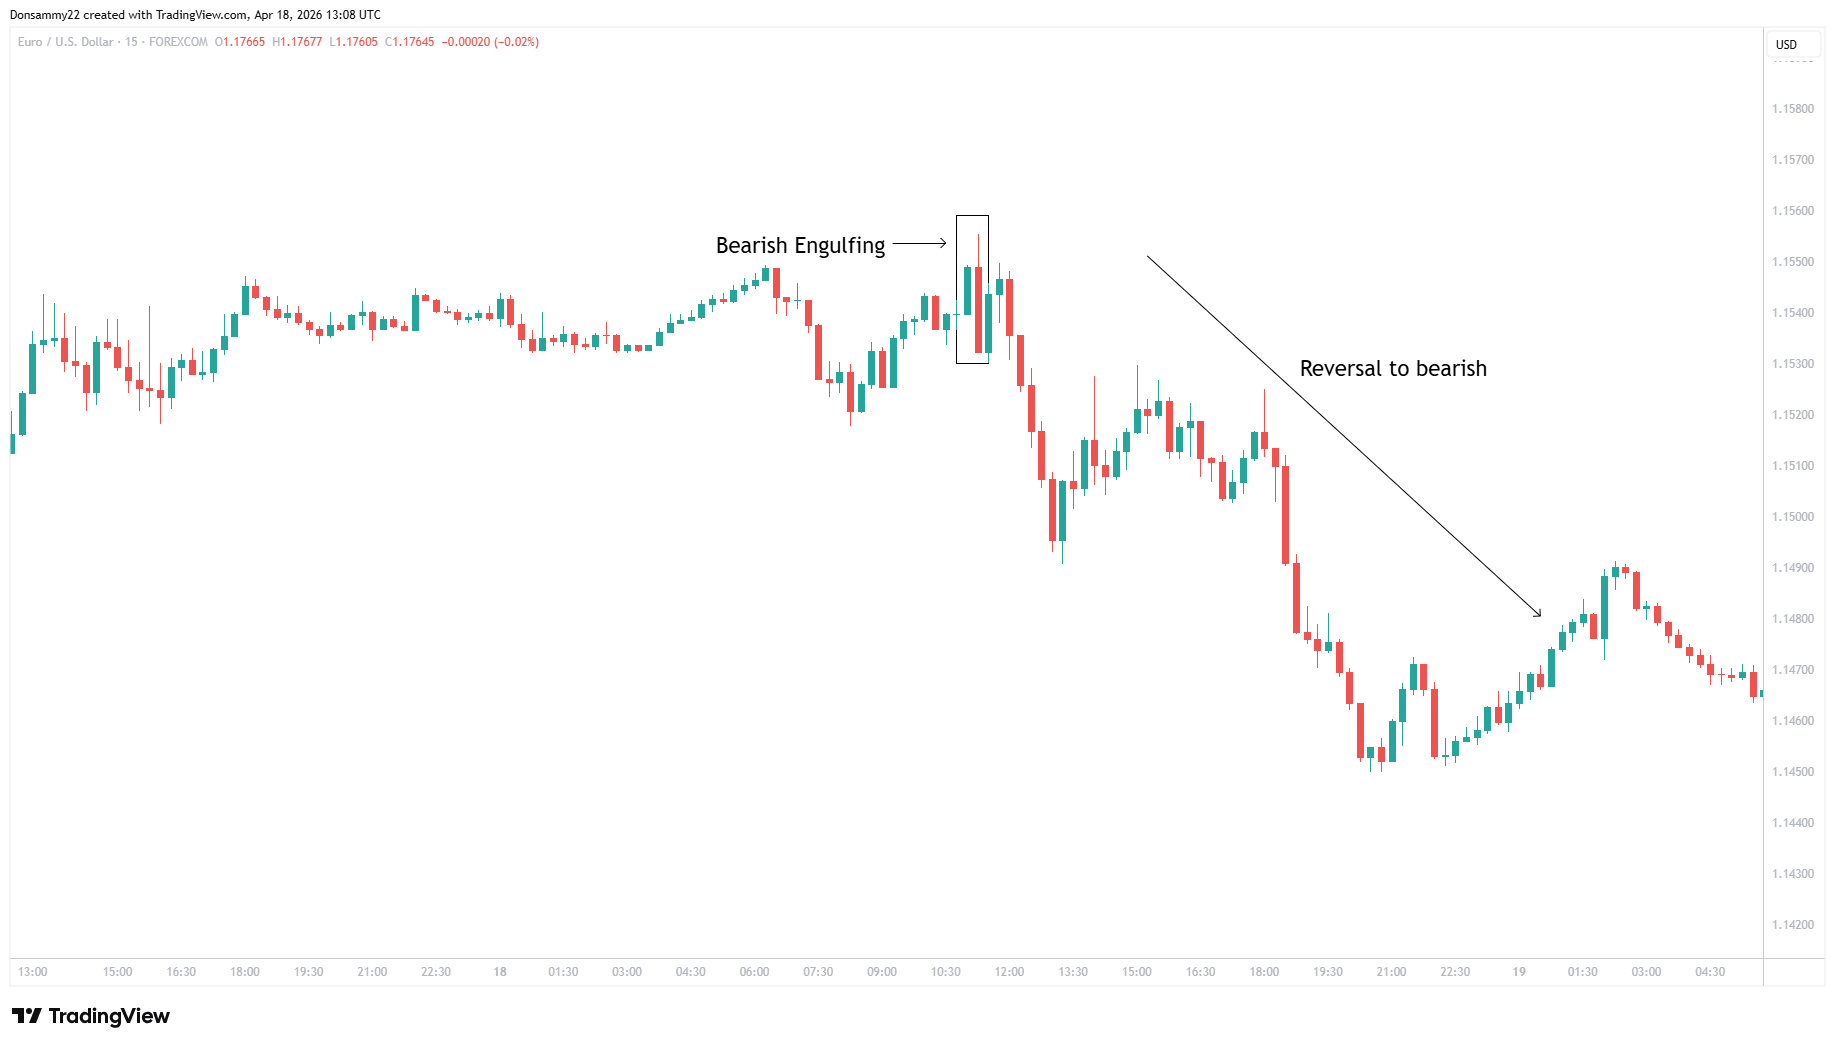
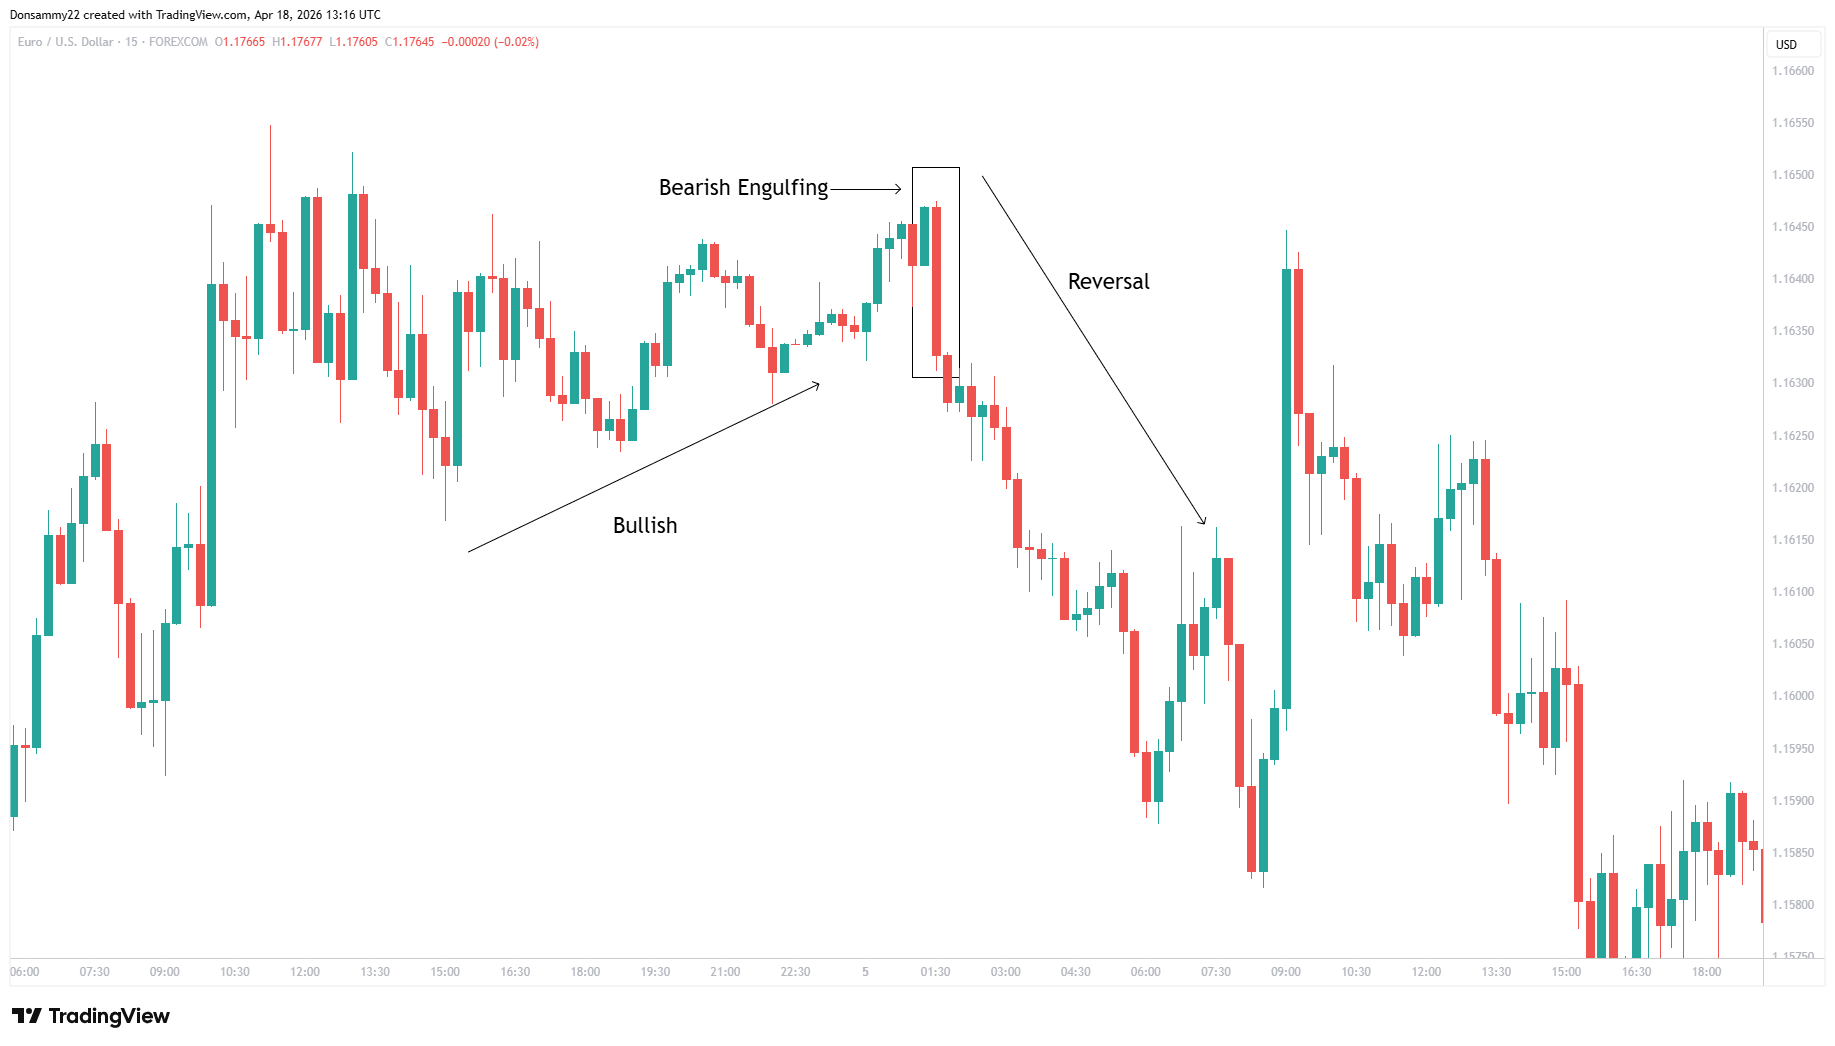
Bearish Engulfing Pattern
This pattern is the opposite of the bullish engulfing pattern. It occurs when a bullish candle is followed by a larger bearish candle that completely covers it. This shows that sellers have taken control.
Examples On Chart
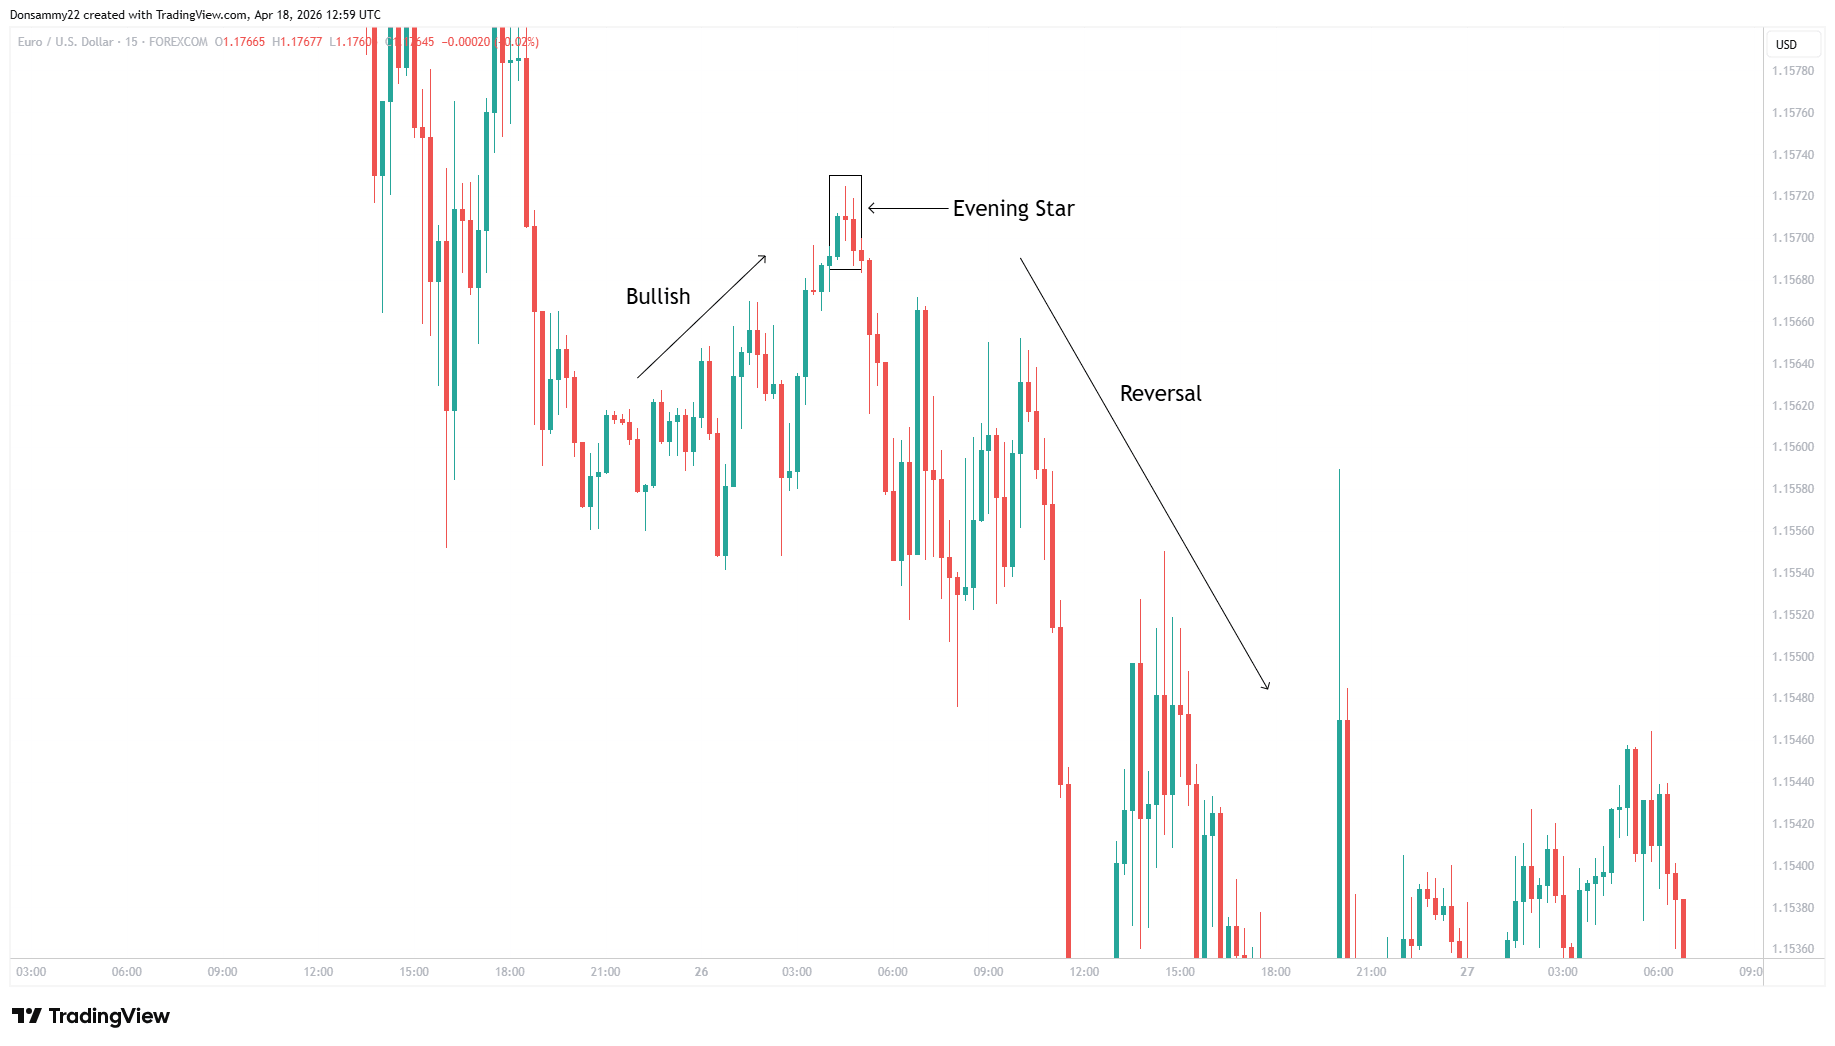
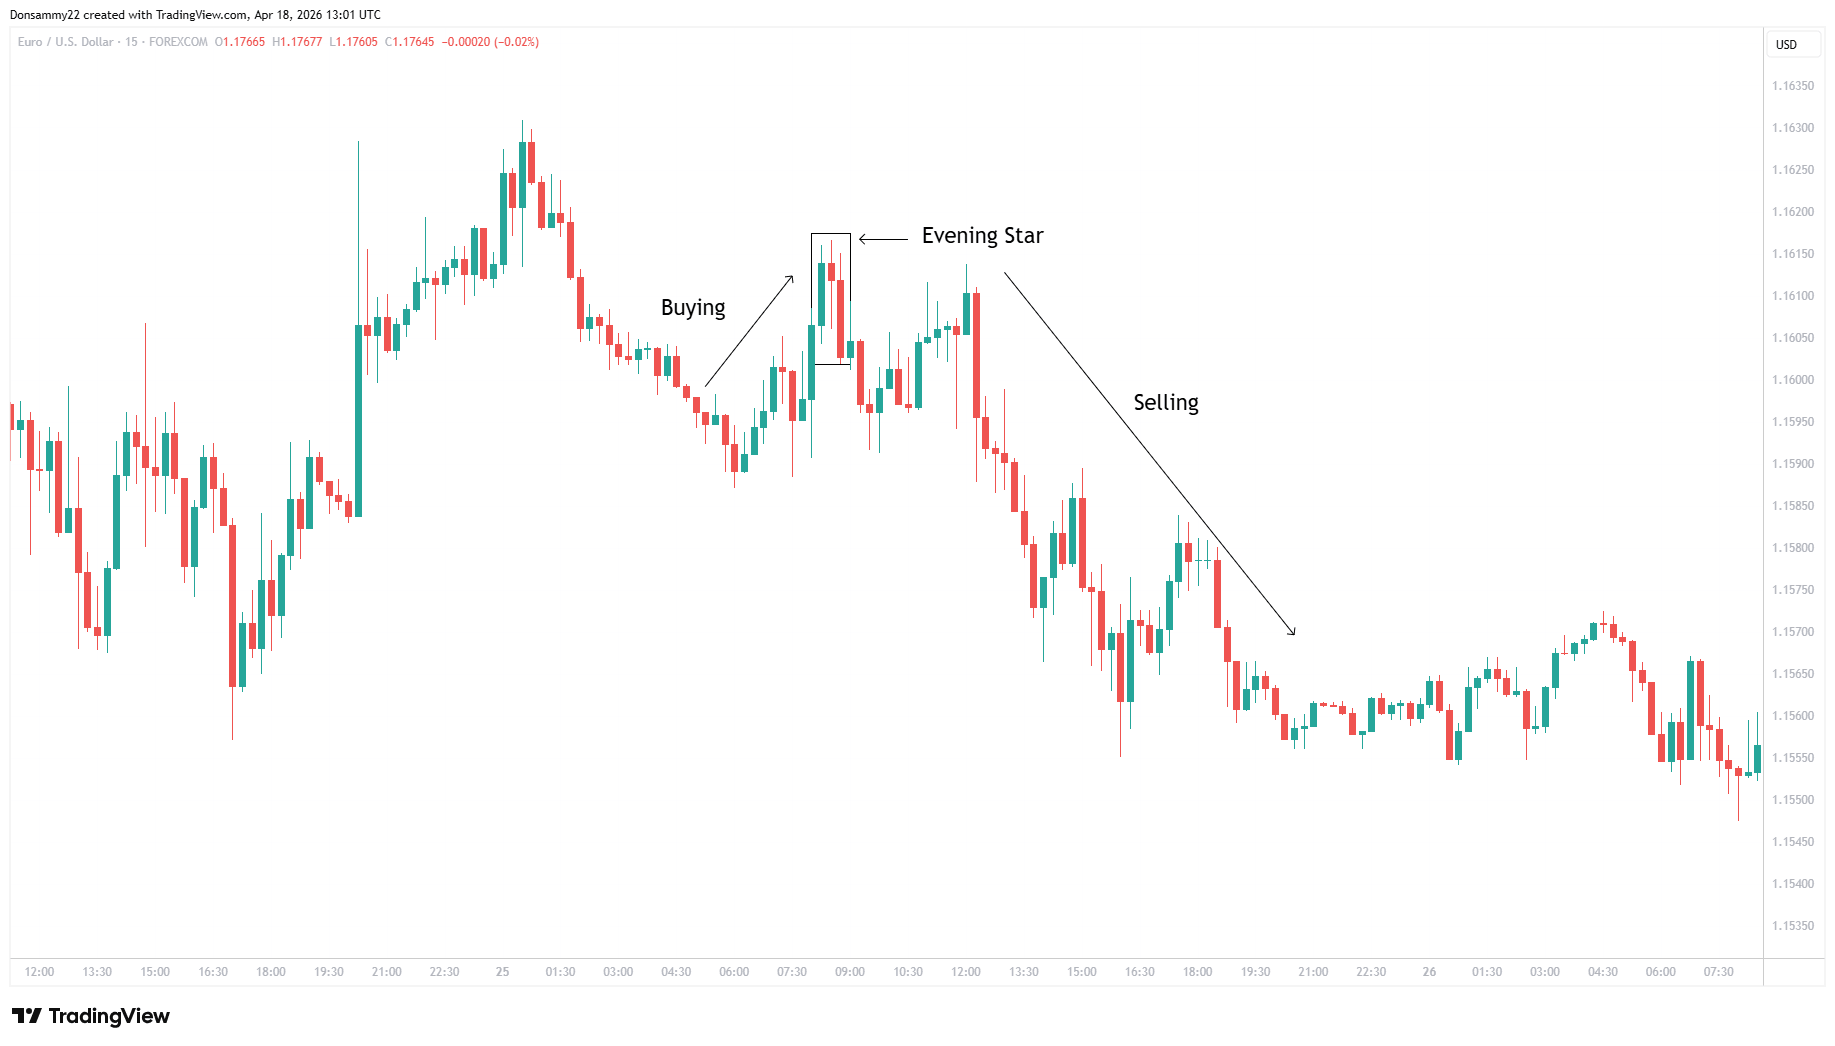
Evening Star
The evening star is a three candle pattern that signals a possible reversal from bullish to bearish. It shows that buying strength is fading and sellers are gaining momentum.
Examples On Chart
Continuation and Indecision Patterns
Not all candlestick patterns signal reversals. Some show hesitation or continuation, where both buyers and sellers are trying to take control.
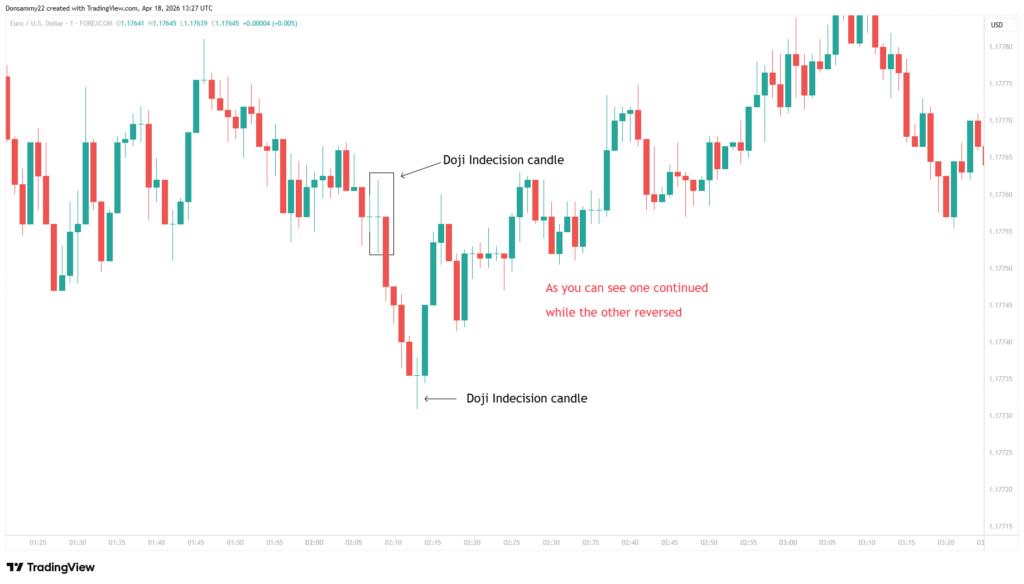
Doji
A doji is one of the most important indecision patterns. It forms when the opening and closing prices are almost the same, showing that buyers and sellers are balanced.
Example on Chart
Spinning Top
A spinning top also shows uncertainty in the market. It has a small body with long wicks, meaning neither buyers nor sellers have full control.
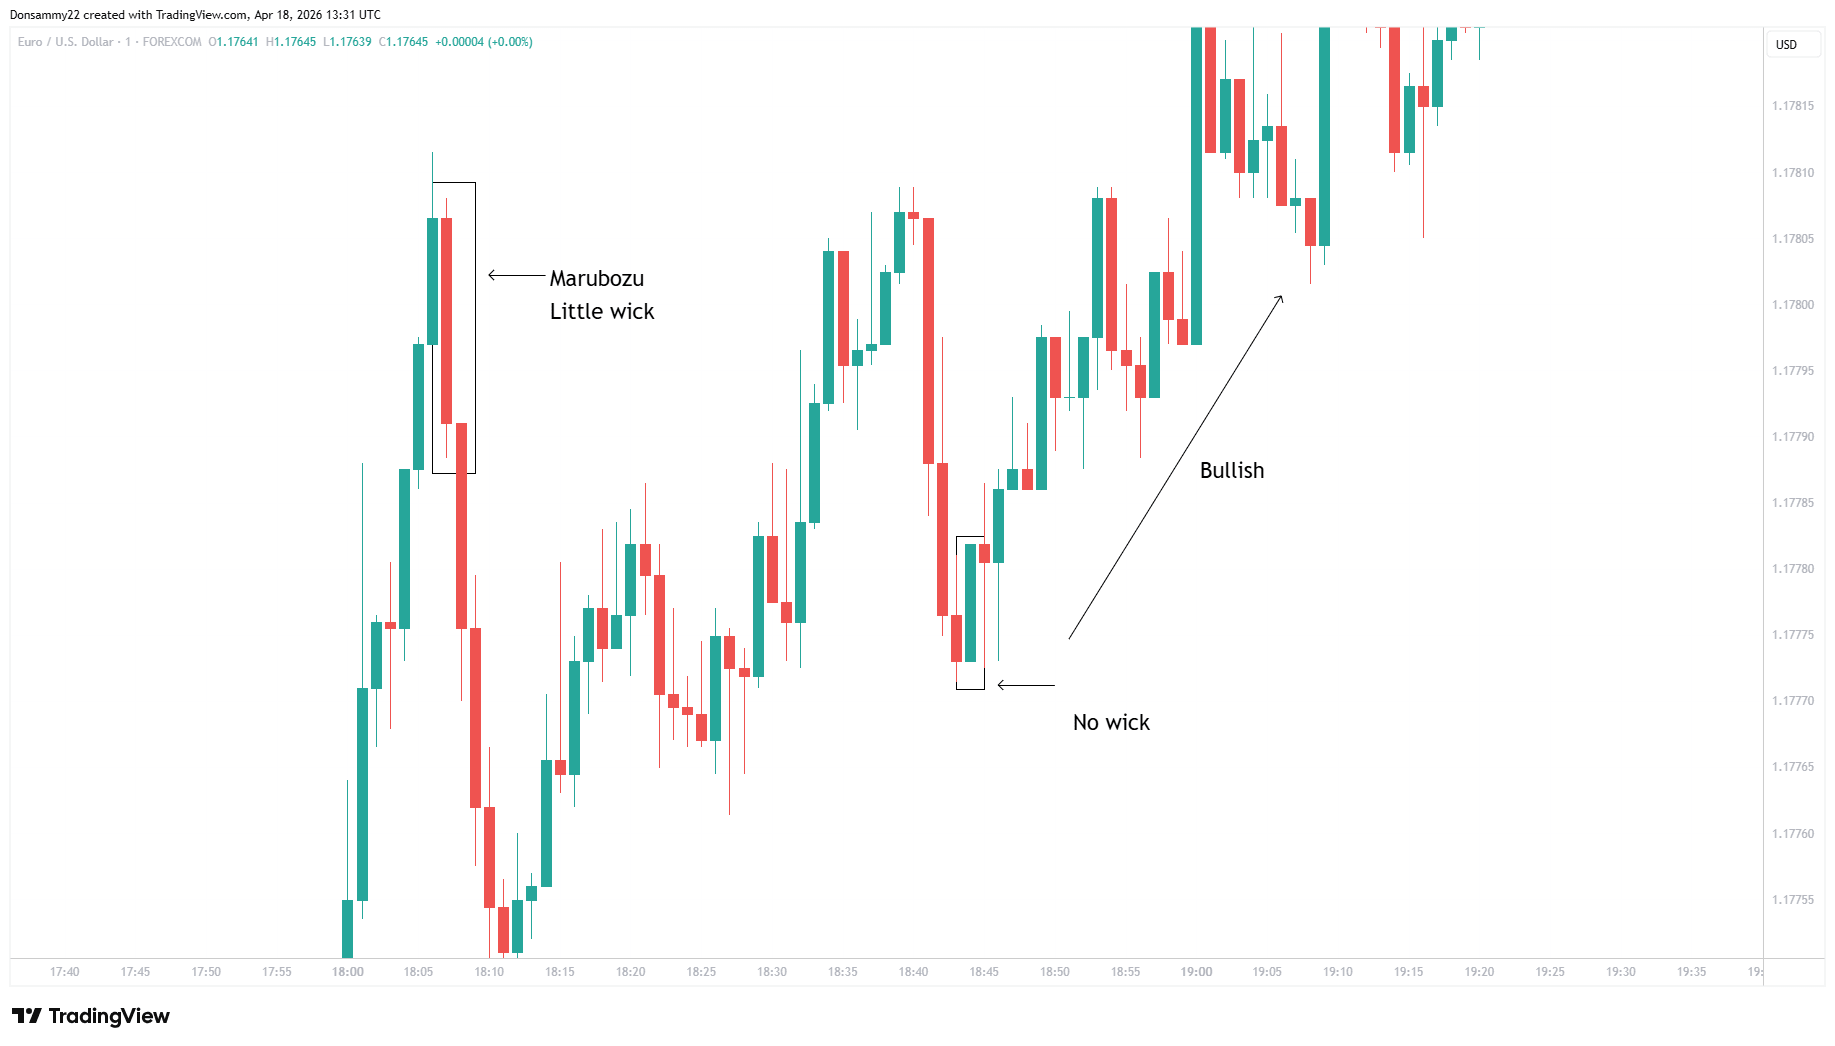
Marubozu
A marubozu candle is the opposite of indecision. It has little to no wick and shows strong buying or selling pressure, often confirming trend continuation.
There are many other candlestick patterns, but these are the most important ones you should focus on as a beginner to avoid confusion.
See on Chart
How to Use Candlestick Patterns Properly
Candlestick patterns should never be used alone. They work best when combined with market trend, support and resistance, and timeframe analysis.
For example, a bullish pattern in a strong uptrend is more reliable than the same pattern in a sideways market. This is why context is very important in trading.
To understand this better, you should also learn how forex market structure works, as it will help you know when a pattern is valid.
Common Mistakes Beginners Make
Many beginners make the mistake of trading every pattern they see. Not every candle formation is meaningful, and some patterns appear frequently but have weak signals.
Another common mistake is ignoring the overall trend. When I first started trading, I made this mistake for a long time before I realized how powerful candlestick patterns become when combined with market direction.
Patterns are more reliable when they align with the trend. Without confirmation, they can lead to false signals.
Quick Assessment
Imagine the market is in a downtrend. You then see a hammer pattern forming at a key support level. The next candle turns bullish and price starts moving upward.
Could this be an early sign that sellers are losing strength and buyers are entering the market?
If your answer is YES, then you are beginning to understand how candlestick patterns work.
What You Should Learn Next
Now that you understand candlestick patterns for beginners, the next step is learning support and resistance. This will help you understand where price is likely to react in the market.
Key Takeaway
Candlestick patterns are one of the most powerful tools in forex trading. They help you understand market behavior instead of guessing what might happen next.
Once you learn how to read them properly and combine them with trends and market structure, your trading decisions become much clearer and more confident.
For further learning, you can also read this detailed explanation on candlestick charts from Investopedia to deepen your understanding.
Leave a Reply to Powerful Risk Management in Forex, Techniques Every Beginner Must Know (2026 Guide) Cancel reply