
Table of Contents
One thing that separates experienced traders from beginners is how they analyze the market.
Most professional traders do not just open one timeframe and enter randomly. They first look at the bigger picture before looking for entries. This is called top down analysis.
Top down analysis in forex helps you understand what the market is doing overall before focusing on smaller movements.
Think of it like traveling to a place you have never been before. You would probably check the main road first before focusing on the smaller streets. That bigger direction helps you avoid confusion.
Forex works the same way.
A lower timeframe might show small buy opportunities, but the higher timeframe may still be strongly bearish overall. This is why many traders prefer using top down analysis because it helps them trade with better direction and understanding.
When I first understood this concept, the market started looking more organized instead of completely random. I stopped forcing entries everywhere and started paying more attention to overall market structure first.
If you have been following one of the popular forex trader Dapo Williams, you would notice how much he emphasizes top down analysis. That is literally part of his strategy.
In this guide, you will learn how top down analysis in forex works and how traders use multiple timeframes together to find cleaner setups and better trading opportunities.
What Is Top Down Analysis in Forex?
Top down analysis is a method traders use to analyze multiple timeframes before taking a trade.
Instead of jumping straight into lower timeframes, you start from the higher timeframe first.
Think of it like using Google Maps.
If you zoom in too much immediately, you may only see one street and get confused. But when you zoom out first, you understand the entire area better before focusing on smaller details.
That is exactly how top down analysis works in forex trading.
The higher timeframe gives you the bigger market direction, while the lower timeframe helps you find better entries.
Why Top Down Analysis Is Important
The market moves differently on different timeframes.
A lower timeframe may look bullish temporarily while the higher timeframe is strongly bearish.
At first glance, the lower timeframe setup may look perfect, but the higher timeframe is quietly controlling the overall direction.
Top down analysis helps you avoid trading against strong market momentum. It also helps you improve accuracy, reduce confusion, filter weak setups, and understand trend direction better.
Understanding the Role of Each Timeframe
Every timeframe has its own purpose.
The higher timeframe helps you identify the main market direction, while the lower timeframe helps you refine entries.
For example, the Daily timeframe may show the market is bullish overall. The 4-hour timeframe may show price pulling back temporarily. Then the 15-minute timeframe may provide the actual entry confirmation.
And just like that, everything starts connecting together.
Simple Top Down Analysis Structure
As a beginner, do not overcomplicate it.
A simple structure is enough.
Make use of 3 timeframes based on your trading style.
Examples:
- 1W – 1D – 1H
- 1D – 4H – 15M
- 4H – 15M – 1M/3M
The higher timeframe is used for trend direction, the medium timeframe is used for structure, while the lower timeframe is used for entries.
For example, you can use:
Daily for overall direction, H4 for key levels and structure, then M15 for entry confirmation.
This combination is very common among traders.
Follow these 4 simple steps to perform a good top down analysis
1. Start From the Higher Timeframe
Always begin with the higher timeframe first.
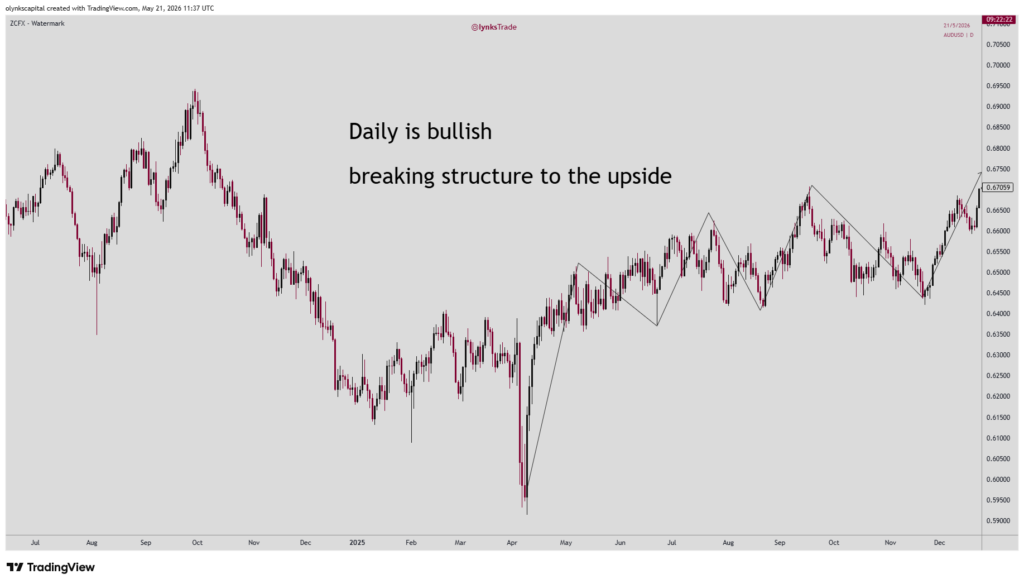
This is where you identify the overall trend, major support and resistance, and the general market structure.
Ask yourself:
Is the market bullish?
Is the market bearish?
Or is it ranging?
This gives you proper market context before looking for entries.
2. Mark Important Levels
Once you understand the higher timeframe direction, switch to the medium timeframe and mark important support and resistance zones.
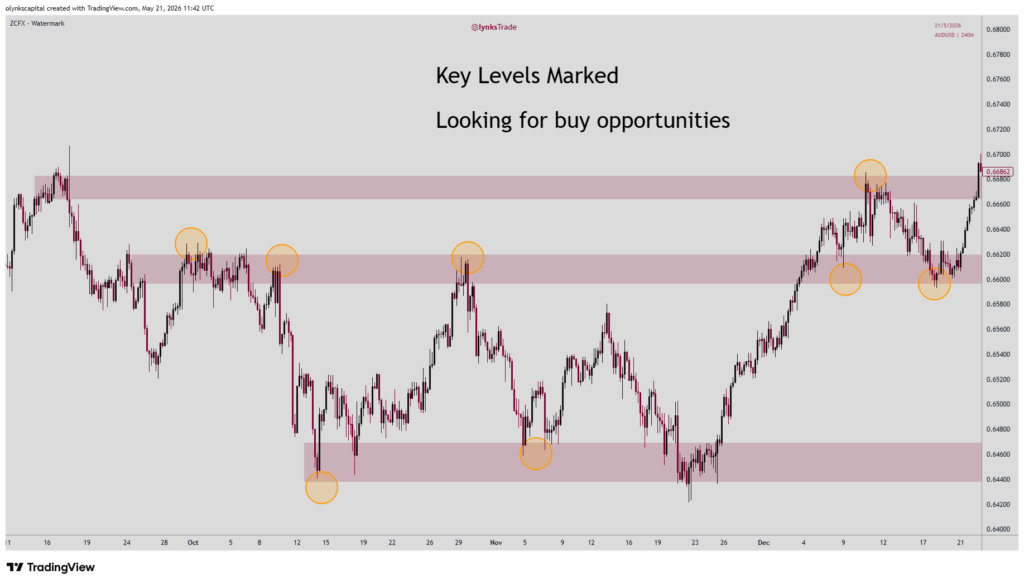
These are areas where price reacted previously.
This connects directly with your support and resistance knowledge.
Also remember that higher timeframe levels are usually stronger than lower timeframe levels.
3. Move to the Lower Timeframe
Now move down to the lower timeframe for entries.
This is where you look for cleaner setups, candlestick confirmations, and entry opportunities.
For example, if the higher timeframe is bullish, you now focus mainly on buying opportunities on the lower timeframe.
This helps you stay aligned with market direction instead of fighting the trend.
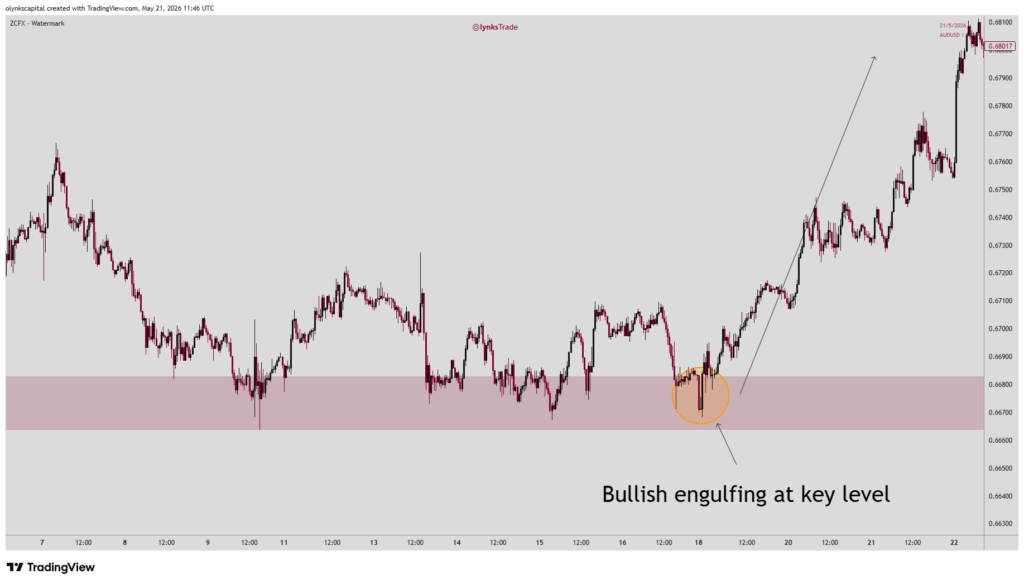
Do not rush entries.
Wait for the market to confirm your idea before entering a trade.
This confirmation could come in the form of:
bullish engulfing patterns, bearish engulfing patterns, rejection candles, or break and retest setups.
This is where patience becomes very important.
Sometimes the market tests your patience before rewarding discipline.
Real-Life Example of Top Down Analysis
Imagine this scenario.
You check the Daily chart and notice EUR/USD is in a strong uptrend.
Then you move to the H4 timeframe and see price pulling back into a support zone.
Finally, on the M15 timeframe, you spot a bullish engulfing candle forming at that support.
Now everything starts aligning together.
You have:
higher timeframe trend,
support confluence,
and lower timeframe confirmation.
This is how structured trading decisions are made.
Not random guessing.
Don’t Make These Beginner Mistakes
Many beginners struggle with top down analysis because they overcomplicate it.
One common mistake is checking too many timeframes at once.
You do not need to keep switching around:
1-minute,
3-minute,
5-minute,
15-minute,
30-minute,
and 1-hour charts all together.
At that point, confusion will humble you quickly.
Another mistake is ignoring the higher timeframe completely and trading only lower timeframe signals.
This often leads to trading against the main trend.
Some traders also force trades even when the timeframes are not aligned.
If the market structure looks messy, it is okay to stay out.
Not every chart deserves your money.
Professional traders understand that the market moves in layers.
The higher timeframe controls the bigger direction, while the lower timeframe simply reacts within that movement.
This is why experienced traders rarely take trades blindly from lower timeframes alone.
They want alignment.
And that alignment increases probability.
The Psychology Behind Multi Timeframe Analysis
Top down analysis also improves emotional control.
Why?
Because you are no longer entering trades based purely on excitement.
You are following a structured process.
And structure reduces emotional decision-making massively.
Quick Assessment
If the Daily timeframe is strongly bullish, should you focus more on buying or selling opportunities on lower timeframes?
Buying opportunities.
If lower timeframe signals completely disagree with higher timeframe direction, should you rush the trade?
No.
Key Takeaway
Top down analysis helps you stop trading blindly.
It teaches you to see the bigger market picture before focusing on entries.
Once you understand how multiple timeframes work together, the market starts making much more sense.
Sometimes the best trade decision is not entering quickly.
Sometimes it is simply waiting for alignment.
learn more about multi timeframe market analysis multi timeframe analysis guide by FXStreet

Leave a Reply